Working in the oil and gas industry, you will hear about a blend of technical measurement issues and scenarios that cause high measurement uncertainty challenges.
I would like to take a deep dive into multiple concepts and challenges that multiple working interest partners face in regards to process issues, reporting delineation issues, accounting issues, measurement design problems, and audit trail issues.
My name is Blair Hamer and I have been working in measurement & regulatory for over 10 years. You can catch this presentation originally presented at the CSHM by clicking this link CsHm Measurement Matters – a presentation on Stimulating Measurement Problems
Oil Battery Proration / Third Party Allocation Problems
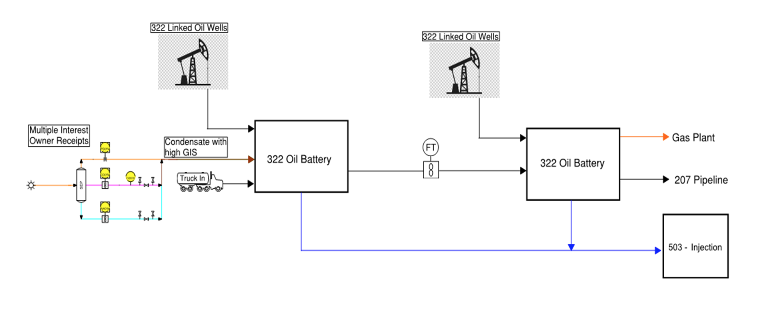
Intricate was contracted to help resolve an oil battery proration / third party allocation problems. The basic facility delineation originally included two large oil batteries in the Duvernay. The first oil battery delivering into the second oil battery, and then on to the points of product sale.
Since this issue took place in the Duvernay, the production was very gaseous. Handling the high gas volumes entrained in the emulsion was a primary concern. Dispositions from the second oil battery were treated as the points of sale, flow lined to the gas plant, the oil pipeline, and the water injection facility.
Initially there were multiple linked oil wells, a few receipt points, and some gas wells. Proration problems began to get out of control when multiple gas wells were drilled and tied into the first oil battery, as seen in the bottom left corner. These multiple working interest gas wells were extremely high condensate producing, especially when first drilled.
Firstly, we need to find out what the problem is. This requires a measurement review and gap analysis to be conducted.
The measurement review and gap analysis included 8 steps:
- Measurement Schematic – table top review
- Equipment design and installation
- Measurement device maintenance
- Audit Trail integrity
- Well testing and S&W practices
- Sampling and analysis practices
- Accounting Algorithms, and
- Reporting delineation
Equipment Design and Installation
In the equipment design and installation it was originally discovered that some equipment was installed correctly, while other components were not in the proper place or were altogether missing on the meter runs.
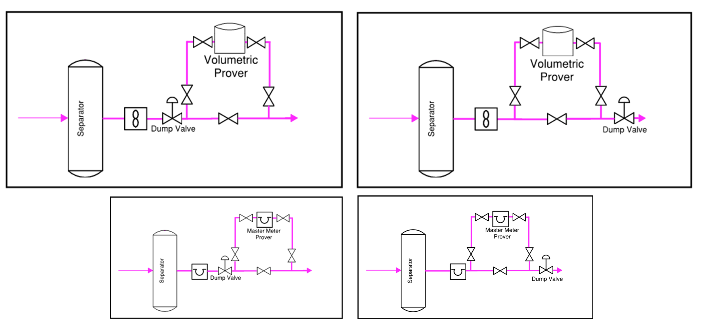
Proving taps for example, were installed in a variety of different locations, some were installed upstream of the separator dump valve, and some were installed downstream of the separator dump valve. Measured receipts existed to a multi-well oil proration battery where they didn’t meet the required delivery point measurement uncertainty.
Liquid turbine meters were selected for all condensate metering, and these also did not meet delivery point measurement uncertainty requirements. Pressures and temperatures were not being measured and applied in many of the liquid flow calculations.
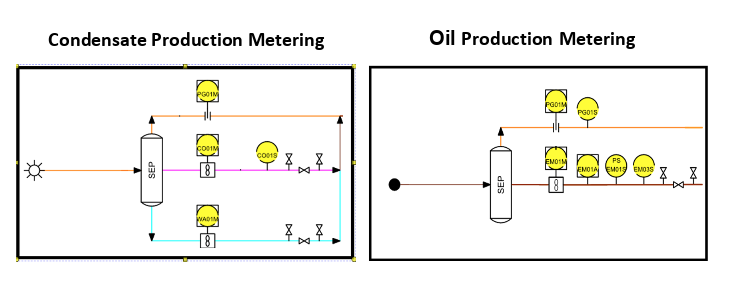
The design of oil production test separator packages were inconsistent, particularly the design of emulsion sampling and Sediment and Water (S&W) measurement. Some packages were designed for grab samples, some with proportional samplers, and some with water cut analyzers.
Flow rates of both oil and condensate production would periodically spike, and often exceed the maximum specified flow range of the turbine meters.
Water-cut analyzer readings would also periodically spike, or drop to a 0 reading. These concerns all pointed to a poor choice of measurement technologies for the application, and also required a more in-depth assessment of flow meter operation and more process information needed to be gathered to enhance the measurement review.
Liquid Turbine Meter Operation
In situations where turbine meters spin extremely fast, it expedites the output signal, and when this occurs the output signal overstates the condensate volume.
Under normal operating conditions, there is an equal amount of resistance on the turbine rotor when the turbine is completely free of debris and no entrained gas is present in the liquid stream.
In the Duvernay & Montney areas and in this case, there was a large amount of entrained gas, or flashing in the turbine meter bodies causing an occurrence called “Jetting”. Jetting is where there is no longer a consistent amount of resistance on the turbine rotor, and the turbine spins erratically.
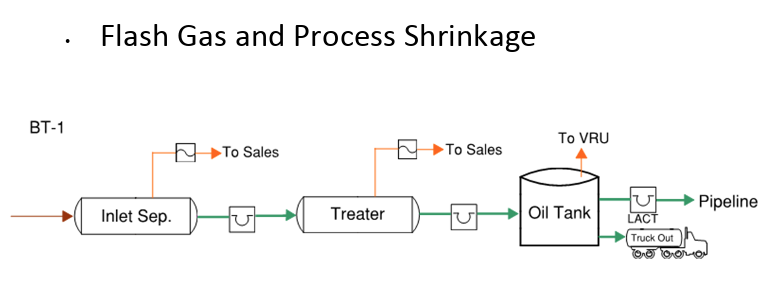
Simply stated, gas breakout in a liquid turbine meter will cause the meter to read high causing measurement challenges in the meter. Through an assessment of process conditions, it was determined that a significant amount of gas breakout and flashing was occurring in the turbine meters, and in some of the other instrumentation located downstream of the turbines.
Water cut analyzers were also deemed to be malfunctioning due to high separator differential pressures. This was occurring in both gas and oil well testing separator packages.
The jetting of turbine meters and the high separator differential pressures caused increased effects of flashing in condensate producing gas wells; in essence causing receipt point condensate volumes to be recorded much higher and gas volumes lower than what they should have been.
Sales Oil Metering
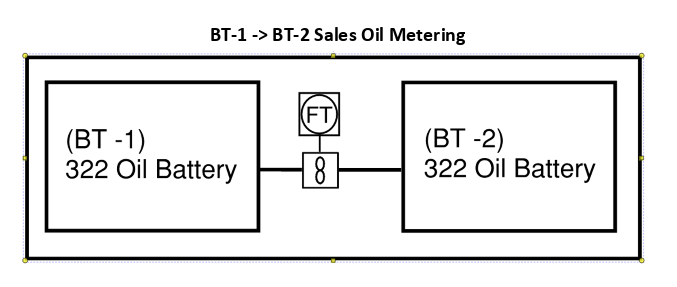
From battery 1 to battery 2 a liquid turbine meter was in place for sales oil metering, which did not meet the necessary delivery point measurement uncertainty requirements.
For example:
- Jetting would sometimes occur
- Live pressure and temperature correction was not installed, and
- Water Cuts were determined by grab samples; which have gaps and are not representative of the entire volume flow, allowing for inconsistencies and greater measurement uncertainty.
Meter Proving Practices
Throughout this case study, the meter proves were originally completed by master meters, and then the operators switched to volumetric provers, back to master meters.
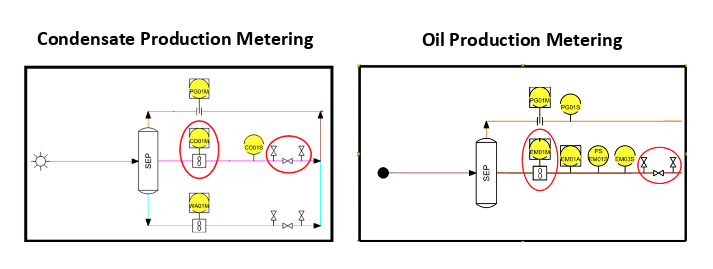
We found the proving taps were installed in a variety of different locations, some were installed upstream of the separator dump valve, and some were installed downstream of the separator dump valve.
Directive 017 Section 2.6: States that Master meters, may be connected either upstream (provided there is no gas breakout) or downstream of the meter before a snap acting control/dump valve.
Also in section 2.6: Tank-type volumetric or gravimetric provers must be connected downstream of the meter and downstream of a snap acting control/dump valve. In the gap analysis, this was inconsistently seen.
Master Meter Proving
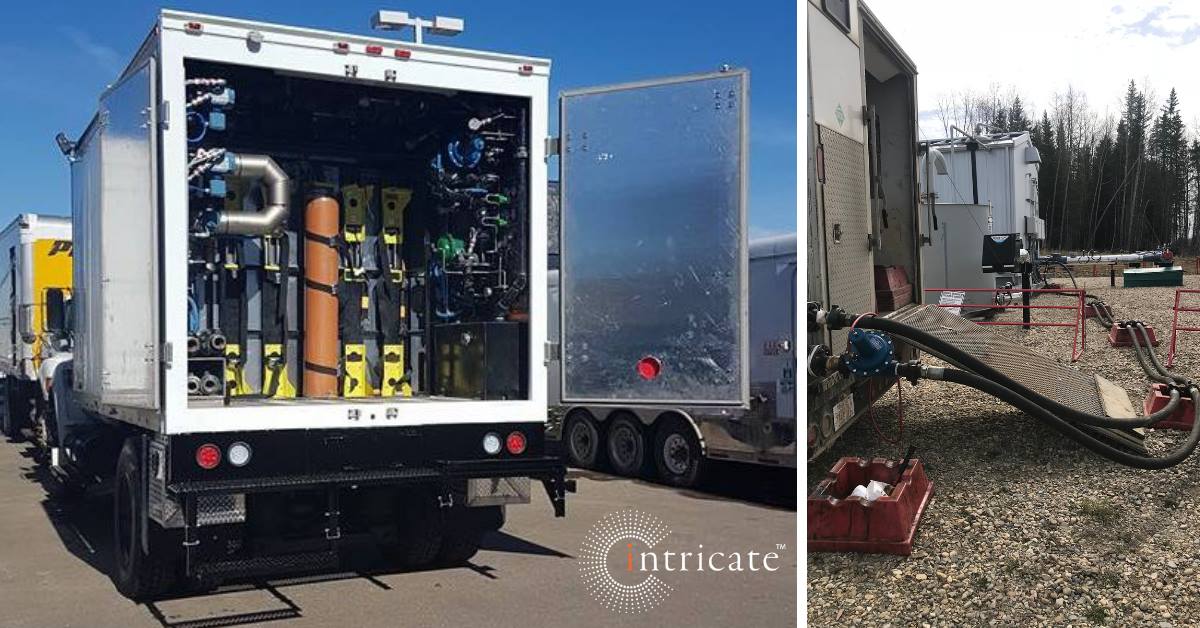
During our review, we discovered a third party receipt point operator that used master meter proving, where a combination of turbine meters and Coriolis meters were used.
There were many instances in the proving reports of gas breakout and flashing in both the proven meter and master meter. Liquid density measurement was not consistent from one prove to the next.
Proving reports did not indicate how or where shrinkage factors were being applied; they may have been applied in some situations and others they were not. This was challenging to decipher as the audit trails were lacking.
As depicted on the right hand side of the diagram above, proving taps were recommended to be moved upstream of the dump valve for more consistent master meter proving results.
In our investigation it was discovered when volumetric proving occurred only a partial de-gas was conducted on most of the volumetric proves, to determine what the meter provers called a “flash factor”.
When comparing results of meter proves with a full de-gas procedure (to a partial de-gas), it was evident that the partial de-gas would have induced a significant amount of uncertainty to the proving results.
Proving General Assessment:
Overall it was discovered that proving frequencies were inconsistent, anywhere from 2 weeks to 6 months (depending on the well). The proving frequencies should have been monthly on all receipt point wells to meet delivery point measurement requirements. Furthermore, when wells were first drilled, meters were not always proven immediately. Resultant meter factors from the first prove should have been applied back to the uncorrected flow volumes, but this did not occur. On one of these proving reports, the technician noted an approximate ~25% shift in meter factor from the factory K-factor.
From a measurement specialist perspective, when there is such a large shift in meter factors, it demonstrates that the wrong type of meter was originally installed. This can be corrected by initially choosing the right type of meter. When choosing meters, it is beneficial to reach out to a measurement specialist for confirmation of approved meter types to the volumetric application in which the meter will be utilized.
Regardless of proving technology used, it was identified that meter provers were consistently unable to prove at normal operating conditions, process conditions were continually needing to be adjusted for consistent proving runs.
Provers often left comments such as “found gas running through the meter”, or “used micro-motion Coriolis meter to prove the meter, as-found with 100% drive gain” (these comments indicate there was often entrained gas flowing through the liquid meters), As we continued to learn more about the historical proves, it became evident that meter factors were very inconsistent from one prove to the next. Review of the meter factors showed huge swings, with the single largest meter factor shift being noted around ~18%.
Accounting Algorithms
We have assessed there would have been a large amount of gas breakout occurring between well measurement and the facility inlet. The inlet separator, treater, and tanks all saw quite a bit of flashing and gas breakout due to volatility of the hydrocarbon liquid products; these flash volumes were not being determined or applied.
The Measurement Review and Gap Analysis
From the measurement review and gap analysis, remediation opportunities were identified. The Measurement Review and Gap Analysis continued to look at the Audit Trail Integrity, Well Testing, and S&W Practices.For the Audit Trail Integrity there was inadequate Electronic Flow Measurement (EFM) audit trail, missing proving records, and missing S&W determination records.
In an attempt to backdate volumes equitably, we wanted to utilize historical EFM records for volume corrections which would then be fairly distributed to the working interest partners.
An EFM audit trail consists of a daily report, meter report, event logs, and alarm logs. When these EFM reports and logs were requested, the working interest partners had a challenging time providing the data needed to equitably determine volumes.
“When evaluating EPAP’s theme 7 Electronic Flow Measurement; Intricate often finds there is a lack of EFM audit trails with many operators, and the data we do receive for EFM audit trail is often missing key data points. Many times, we only receive event logs, or alarm logs, but not the daily or meter report. Of course, we work with our clients in their EPAP remediation plans to ensure this improves”
We wanted to utilize past proves to help determine historical volumes through a meter factor tracking sheet. This historical tracking sheet would then incorporate all the meter factors to help determine volumes – not a bad idea right?
BUT…when we asked for the proving records, they were missing completely. A similar situation occurred for the S&W determination records. This was partly due to the three different S&W methodologies and equipment that was in place, for these reasons the S&W audit trail was also deemed to be unreliable to help trace historical volumes for the working interest parties.
Remediation Opportunities – Measurement and Accounting Manual
A measurement & accounting manual allows for all working interest parties to review and agree on an equitable accounting structure that accounts for:
- A new equitable reporting delineation with subtypes and volumetric flow, complete with updated schematic. (Allowing for a more accurate measurement certainty model to be implemented)
- An agreeance to the equipment engineering design and installation. It is value added to have industry approved (manufacture, API, and/or AGA) standardized meter run diagrams (When conducting measurement reviews we find facilities are not always set up properly, causing swirls and uneven flow through the metering technology which creates measurement uncertainty)
- Standard operating procedures that were developed and agreed upon; and they were: Well testing, Trucking, Sampling and analysis, Proving, Calibration, and an organized / reliable audit trail
- For Maintenance practices and frequencies (Consistent meter proving and calibration practices were developed)
- Sampling and analysis, frequencies and practices
a. An approved Validation procedure was written, proposed, and implemented ensuring a correct use of analysis data.
b. We also wanted to ensure consistency of sampling
c. Where initially a variety of sampling occurred from grab samples, to proportional samplers, to water cut analyzers, which were not being calibrated. - Accounting and allocation calculation formulas were created through agreed upon methodologies (With regards to everything on this slide, processes were documented allowing all working interest parties to review, provide input, and sign off on the new plans)
Meter Run Diagrams
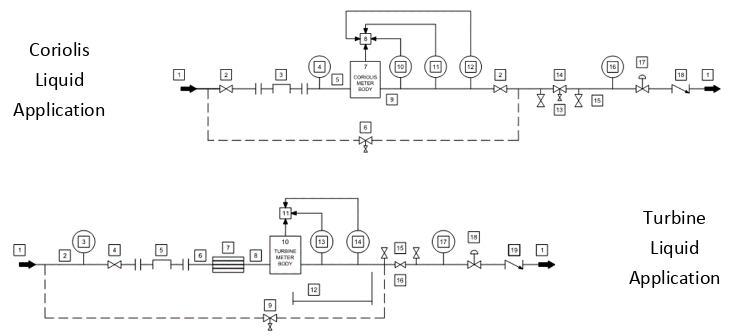
The Coriolis and Turbine Liquid meter runs can be designed for all meters in all applications and become a nice reference tool for operators and engineers.
Reporting Delineation
This original reporting delineation caused many measurement uncertainties in the following high level areas:
- Turbine meters on condensate lines were inaccurate due to jetting, unreliable proves, entrained gas and a meter selection that couldn’t handle the amount of volume coming through it.
- Out of tolerance proration factors where the prorated wells took on the measurement uncertainty risk of the measurement by difference to the measured volumes.
- Pressures and Temperatures did not exist, were not installed correctly, or were not applied in volume determination systems and calculations.
- Trucked in points did not meet delivery point requirements. Trucked allocation Factors will influence the overall oil volumes that are kept whole, thus influencing the proration factors to the 322 prorated oil wells.
New Reporting Delineation / Allocation Model
The new reporting delineation sought to correct the previously discussed challenges.
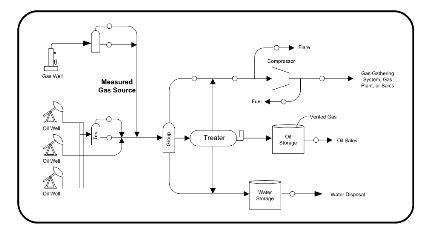
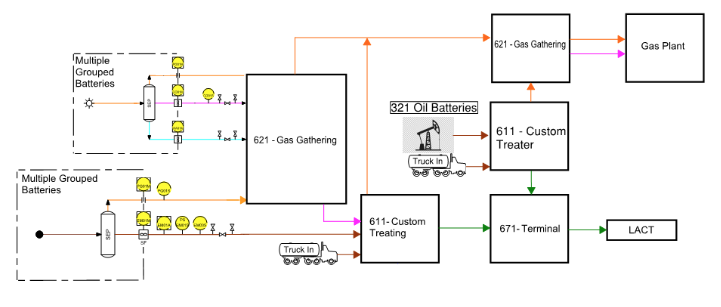
Let’s follow the oil production flow starting in the bottom left corner. The oil well pads were grouped into a 321 sub-type, multi-well oil batteries. Liquid hydrocarbons and oil wells delivered to the 611 subtype – custom treating facility, and then to the 671 subtype – the terminal. Then the clean oil went to the LACT disposition meter.
This new reporting delineation allowed for more equitable oil / condensate prorated volumes.
For trucking, the new reporting delineation alleviated trucked liquid Measurement by Difference concerns also, because in the old reporting delineation trucked volumes were kept whole and were part of the measurement by difference to the prorated oil wells.
This new reporting delineation also alleviated well level requirements for delivery point measurement, where not every well needed to change from a turbine to a Coriolis meter. As this reporting delineation decreased the number of wells involved in the measurement by difference calculations.
Now let’s focus on the gas production flow in the upper part of the image, with the gas wells being in the top left corner. There were the following 4 key changes regarding gas wells and volatile condensate components delivering to gas gathering systems, and then to the gas plant.
- HYSIS modeling was implemented to create a look-up table for well level process shrinkage and flash data.
2. Daily well pressures, temperatures, and volumes are now used to apply daily shrinkage and flash gas factors in the field data capture (FDC) system.
3. The reporting delineation, proper sampling and analysis, and proving all allow for more equitable gas volumes and component allocation.
4. Condensate meters are now proven to stock tank conditions when delivering to an oil facility.
Delivery Point vs Lease Automatic Custody Transfer (LACT) metering requirements, as seen in the bottom right of this image leaving the 671 terminal:
- Delivery Point is the point at which the delivery of oil or gas production from a battery or facility is measured and are used for royalty calculations (such as sales, cross border, gas plant to facility, or gas plant to gas plant meters).
2. Whereas LACT measurement is where clean hydrocarbon liquids are delivered directly into a pipeline system or trucked to a pipeline terminal, also known as a “custody transfer point”.
3. LACT meters require both pressure and temperature measurement, while Delivery point only requires temperature. For pipelined delivery point measurements, two thermowells should be provided (one for measurement and one for verification).
“If the volume of fluid measured by a delivery point or LACT meter does not exceed 100 cubes/d, the meter proving frequency may be extended to quarterly. Make sure the tag attached to the meter clearly indicates that the meter measures less than 100 cubes/d and that the meter is on a quarterly proving frequency.”
As the new reporting delineation demonstrates:
- If clean oil from a battery is delivered into an oil pipeline via a LACT unit and that same BT also receives clean trucked oil, condensate, or diluent from other sources, a terminal (TM) Petrinex code must be obtained so that the clean trucked-in fluid is received at the TM instead of at the BT (as shown by the two trucks delivering to the 611 subtypes in the middle of this image). The BT oil must also be measured with delivery point measurement before commingling with other fluids at the terminal. The terminal will then deliver the fluid to the pipeline via the LACT unit.
- If there is blending of hydrocarbon liquids of densities > 40 kg/m3, the lighter hydrocarbon used for blending must be received and stored at the terminal and the oil production measured before the blending point.
Applying New Equipment Changes
New meter technology changes included changing turbine meters to Coriolis for the hydrocarbon liquid measurement, allowing meters to:
- Maintain flow rates within specified flow ranges,
- Accept a higher entrained gas tolerance,
- Determine a higher accuracy for allocation points, and
- Implement diagnostic capabilities to alarm if gas was flashing through the meter.
Pressure and temperature measurement was installed and applied for flash gas data gathering. The meter proving taps were moved to a location allowing consistent proves to occur with master meters.
The Battery 1 to Battery 2 sales oil meter was upgraded to a Coriolis meter.
New Meter Proving Equipment & Practices
All working interest parties agreed on master meter proving moving forward, Master meter proving allowed the diagnostics to better detect gas breakout in the proven meter and master meter during the proving procedure.
The plan was to determine HYSIS simulation data, and apply daily well level process shrinkage outside of the metering equipment. Utilizing the look-up tables for well level process shrinkage and flash data. Therefore the master meter proving procedure did not need to measure, account for, or apply process shrinkage; since the HYSIS simulation data was calculated by Production Accounting.
Reporting Amendments at the Well Level
There were attempts to re-calculate historical metered volumes at the well level, but due to an inadequate audit trail, these attempts lacked the data to support the calculations. All of the following points contain the high level process and data required for the attempted volume re-calculation
At the well level methodology, there were:
1. Meter Proving Calculations
2. Changing process conditions influencing pressure and temperature.
3. Re-Calculated volumes with new factors
4. Overall these steps were included in the attempts to accurately recalculate volumes for the working interest parties
For the Well Level Data:
5. Pressure and Temperature data had to be appropriately determined and applied
6. Meter Proving Volumes were assessed, backdated and calculated to what volumes should have been.
7. Metered volumes were analyzed for accuracy
8. And overall monthly volumes were determined after applying all factors that would have effected them.
Re-calculated Condensate Volumes
The measurement team also collected separator and pipeline process data (from the SCADA system), metered data, water-cut analyzer data, and prover data.
The calibration frequency of a water cut analyzer is based on the manufacturer’s recommendation, which is normally annually. In an attempt to backdate well volumes, we put on our SCUBA gear and took a deep dive on 2 gas wells. The 2 gas wells’ historical meter proving were utilized as a sample set to assess if all data could be backdated for accurate volumes:
1. First we removed historical meter factors, returning the meter to what it would have been recording for flow volume at factory conditions.
2. Then we calculated the average meter factor curves based on more up-to-date, acceptable master meter proves.
3. From there we developed and applied meter factor curves based on pressure and temperature recorded in the SCADA system.
4. We applied pressure & temperature correction factors.
5. After incorporating all of those concepts we recalculated the historical metered HCL volumes for these two wells.
In the end however, the volume re-calculation could only focus on tangible data from meter proving documentation, and was unfortunately deemed “not defendable” due to the major uncertainty caused by gas breakout and flashing in the meters.
New Reporting Amendments
New reporting amendments at the Facility Level moving forward now include:
1. Historical field records are currently used as inputs for the new HYSIS modeling and production accounting formulas.
2. Processing updated accounting data through the new reporting delineation.
3. Reporting amendments in Petrinex.
We reviewed and analyzed measurement gaps and attempted to find resolutions that all working interest parties could agree upon. Cost savings strategies were implemented, such as, Coriolis meters were only installed on all delivery points and not all metering points to help reduce costs.
The following reductions in frequency were pursued, Proving, Calibrations, Sampling and Analysis.
There were several meetings with the AER to ensure everything would be compliant. After assessing the challenges, we planned for and provided remediation suggestions to all of the challenges shared in this case study. Intricate collaborated with the working interest parties and implemented an equitable “Go Forward” Plan. Where possible and when the audit trail was reliable, we amended the reporting data.
In the end, the working interest partners assessed many methodologies to back date and correct volumes. Moving forward, all stakeholders reviewed and signed off on the new reporting delineation, measurement concepts, and approved measurement plan.
Intricate’s measurement & regulatory department is one of the largest in Western Canada and our reporting integrity programs are used in the energy sector industry to prove a high level of financial, regulatory compliance and volumetric reporting assurance to provincial regulators.
I hope you’ve established some takeaways into your own measurement situations and if you’d like to have a chat and learn more about this case study or discuss your own measurement challenges, please reach out to myself, blairhamer@intricategroup.com
Intricate’s measurement and regulatory programs establish a corporate baseline and coordinate findings with regulatory governing programs throughout Western Canada while maintaining a cost-effective process.
Want more information?
Check out these other measurement topics on our blog!
Understanding EPAP, How to Improve Your Business Value
The Enhanced Production Audit Program, or EPAP, is a compliance program that encourages operators to improve their measurement and reporting systems to make them more compliant with the Alberta Energy Operator, or AER. EPAP allows operators to avoid paying excessive...
How to Achieve Greater Business Value with EPAP
Intricate has conducted dozens of Enhanced Production Audit Program reviews in Alberta, and it is apparent that needs vary depending on a company’s size, resources, business processes, and current measurement compliance. What may be required for a large producer is...
Meter Proving: Precision and Certainty is Everything
Performance and safety are both dependent on the accuracy of your tools, and without knowing how accurate they are, you put your teams and your budgets at risk. Why do we prove meters? To provide accurate measurement to minimize losses and maximize...

